
4 Pillar Funding Research · Texas Infrastructure
From Megawatts to Working Capital
The Financial Infrastructure Behind Texas’ AI Data Center Buildout
The report in one sentence
At the market level, megawatts must be classified by what they represent. At the contractor level, working capital must be modeled by when costs are incurred, billed and collected.
Contents
Executive Summary
Texas is planning for prospective electricity demand far beyond the scale its current grid was built to serve. ERCOT’s preliminary long-term forecast reaches approximately 367.8 GW by 2032, compared with a preliminary all-time system peak of approximately 91.1 GW on July 22, 2026. The peak may change slightly through settlement. The 2032 figure is a planning forecast, not a committed buildout: ERCOT is still identifying, verifying and studying large new loads.[1][2]
The distinction matters because Texas now has several different measures of data-center and large-load demand. Oncor reported approximately 282 GW of data-center-related transmission interconnection requests at June 30, 2026. Separately, management expected approximately 44 GW of large-load requests to be eligible for Batch Zero treatment as base or studied load, including roughly 8 GW of existing interconnected load ramping toward authorized capacity. CenterPoint reported more than 17 GW submitted into Batch Zero and approximately 14 GW expected by management to be eligible as base or studied load.
These are differently defined system views, not conversion ratios. As of August 11, 2026, ERCOT had not published an official statewide aggregate of final Batch Zero classifications in the public materials reviewed for this report.[4][5][6]
Project evidence also varies. Vantage says construction has begun on its planned 1.4-GW Frontier campus, while Meta says its 1-GW El Paso campus is under construction. DataBank first financed three fully leased 60-MW buildings at Red Oak, then increased total construction financing to approximately $2.65 billion for a fourth building within the planned 480-MW campus. Other developments remain announcements, registered projects or construction-filed scopes.
The report therefore uses an Observable Execution Evidence Framework rather than a statewide MW funnel. It measures the public record—sponsor statements, filings, financing, construction and phased operation—without converting incomplete disclosure into a probability of completion.[9][10][11][12]
The physical opportunity extends beyond the data hall. For many campuses, transmission, substations, generation, site development, equipment procurement and onsite construction proceed in parallel. Oncor says a group of endorsed North and Central Texas transmission projects is expected to require more than $7 billion of investment during 2026–2034. CenterPoint increased its whole-company 2026–2035 capital plan to $66.7 billion, citing accelerating Houston large-load demand as one driver. AEP Texas reports letters of agreement supporting up to 41 GW of potential new load through 2030, alongside nearly 100 transmission projects spanning approximately 2,800 miles.
These programs serve system reliability, manufacturing, energy development and other forms of growth as well as data centers. Their relevance is not that every dollar belongs to AI, but that large-load development is now influencing a broader power-infrastructure cycle. For contractors, that creates opportunity both inside campuses and in the transmission, substation, generation and equipment systems required to serve them.[5][6][7]
Inside the campus, an indicative Turner & Townsend benchmark assigns approximately 76% of air-cooled construction cost and 81% of liquid-cooled construction cost to electrical and mechanical systems combined. The percentages are not universal project ratios, but they explain why the buildout is especially relevant to electrical and mechanical contractors, power-equipment suppliers, modular infrastructure businesses, utility contractors and specialty manufacturers.[17]
Public filings establish the contractor-level cash mechanics. Contractors can incur labor, equipment and subcontractor costs before collections arrive. Contract assets, receivables and retainage can hold cash at different stages, while bonds and letters of credit can consume financial capacity. The same filings show the counterpoint: customer advances, milestone billing and favorable early billing can materially reduce the contractor-funded cash requirement.[18][19][20][21][22]
The corrected 4 Pillar Backlog-to-Liquidity Model holds constant a hypothetical $10 million, 15-month project awarded to a hypothetical $25 million contractor and changes the project and contract terms. The favorable profile produces no modeled month-end project-cash deficit. The balanced profile reaches approximately $0.50 million in Month 7, fully covered by the company’s assumed $1.40 million of usable liquidity. Intermediate profiles produce approximately $0.72 million to $1.38 million of peak deficit. A deliberately combined downside stress case reaches approximately $3.53 million, leaving a residual external funding gap of approximately $2.13 million after the liquidity overlay.
The model does not show that a $10 million award inherently requires financing. It shows that contract value alone is insufficient to estimate working-capital need. Project scope, cost timing and contract terms determine how much capital is required, when and for how long. The result is a capital-planning framework, not a presumption that every award requires debt.
Key findings
- Headline megawatts are not interchangeable; requested load, studied load, announced capacity, construction and operating capacity answer different questions.
- Observable evidence supports a staged framework, not a precise statewide MW realization funnel.
- Power and thermal systems concentrate a substantial share of indicative data-center construction cost.
- The same $10 million award can produce no modeled month-end deficit or a $3.53 million peak deficit when scope and contract terms change.
- Outside capital is needed only after usable liquidity is measured against the modeled project-cash trough.
Model the cash terms of the backlog before you finance the backlog.
I. Texas’ Headline Megawatts Measure Different Things
The Texas data-center market is often described through very large numbers. The problem is not necessarily the numbers; it is treating unlike measures as one pipeline. A service request describes a utility process. A sponsor announcement describes intent. Gross site power, interconnection capacity and critical IT load can refer to different electrical boundaries. Construction and energization add still different forms of evidence.
| Measure | What it can establish | What it does not establish |
|---|---|---|
| Requested or submitted load | A developer or customer has entered a utility or planning process | Construction, customer financing or eventual energization |
| Base/studied load | A planning classification under the applicable ERCOT process | Project completion or a guaranteed energization date |
| Announced campus capacity | Sponsor-stated ultimate or phased ambition | Near-term operating capacity |
| Construction-filed scope | Formal public evidence of a building or project scope | That work began on the scheduled date |
| Active construction | Physical project execution is underway | Completion of all planned phases |
| Energized or operating capacity | Defined infrastructure or computing capacity is in service | Completion of future expansion or conversion scope |
ERCOT’s preliminary 367.8-GW forecast belongs in this taxonomy. It indicates the scale of demand planners are being asked to evaluate; it is not a project list.[2]
Oncor’s Q2 disclosure provides the clearest utility example. The company reported 737 active large-commercial-and-industrial interconnection requests, including approximately 282 GW associated with data centers. It separately expected approximately 44 GW of large-load requests to be eligible as Batch Zero base or studied load, including approximately 8 GW of existing interconnected load ramping toward authorized capacity. Oncor also held approximately $2 billion of large-load customer collateral related to Batch Zero projects, within approximately $5.9 billion of collateral across active generation and large-load point-of-interconnection requests.[5]
Those figures show different levels of planning and financial commitment. Site control, financial security and study maturity can make a load more useful for system planning, but they do not establish that 44 GW will be built on a particular schedule. Nor do they support a percentage comparison with the 282-GW data-center request universe, which is defined differently.
CenterPoint reported more than 17 GW submitted into Batch Zero and approximately 14 GW expected by management to be eligible as base or studied load. The company noted that 14 GW would equal more than 65% of its current 21-GW Houston Electric peak. That comparison illustrates planning consequence, not an ERCOT-certified construction forecast.[6]
Batch Zero is designed to give ERCOT a more structured view of qualifying large loads, allocate study treatment and identify the transmission implications of serving them. It does not determine which developments ultimately obtain financing, complete construction or reach their announced capacity. ERCOT set an August 7 classification-notification deadline and said public aggregate statistics would follow as data became available. No official statewide aggregate located in the reviewed public materials had superseded the utility disclosures as of the report date.[3][4]
For operators, the implication is disciplined rather than bearish. A headline megawatt can inform market monitoring and long-range planning. It should not be treated as construction-ready demand without evidence of physical and commercial commitment.
II. From Market Demand to Observable Execution
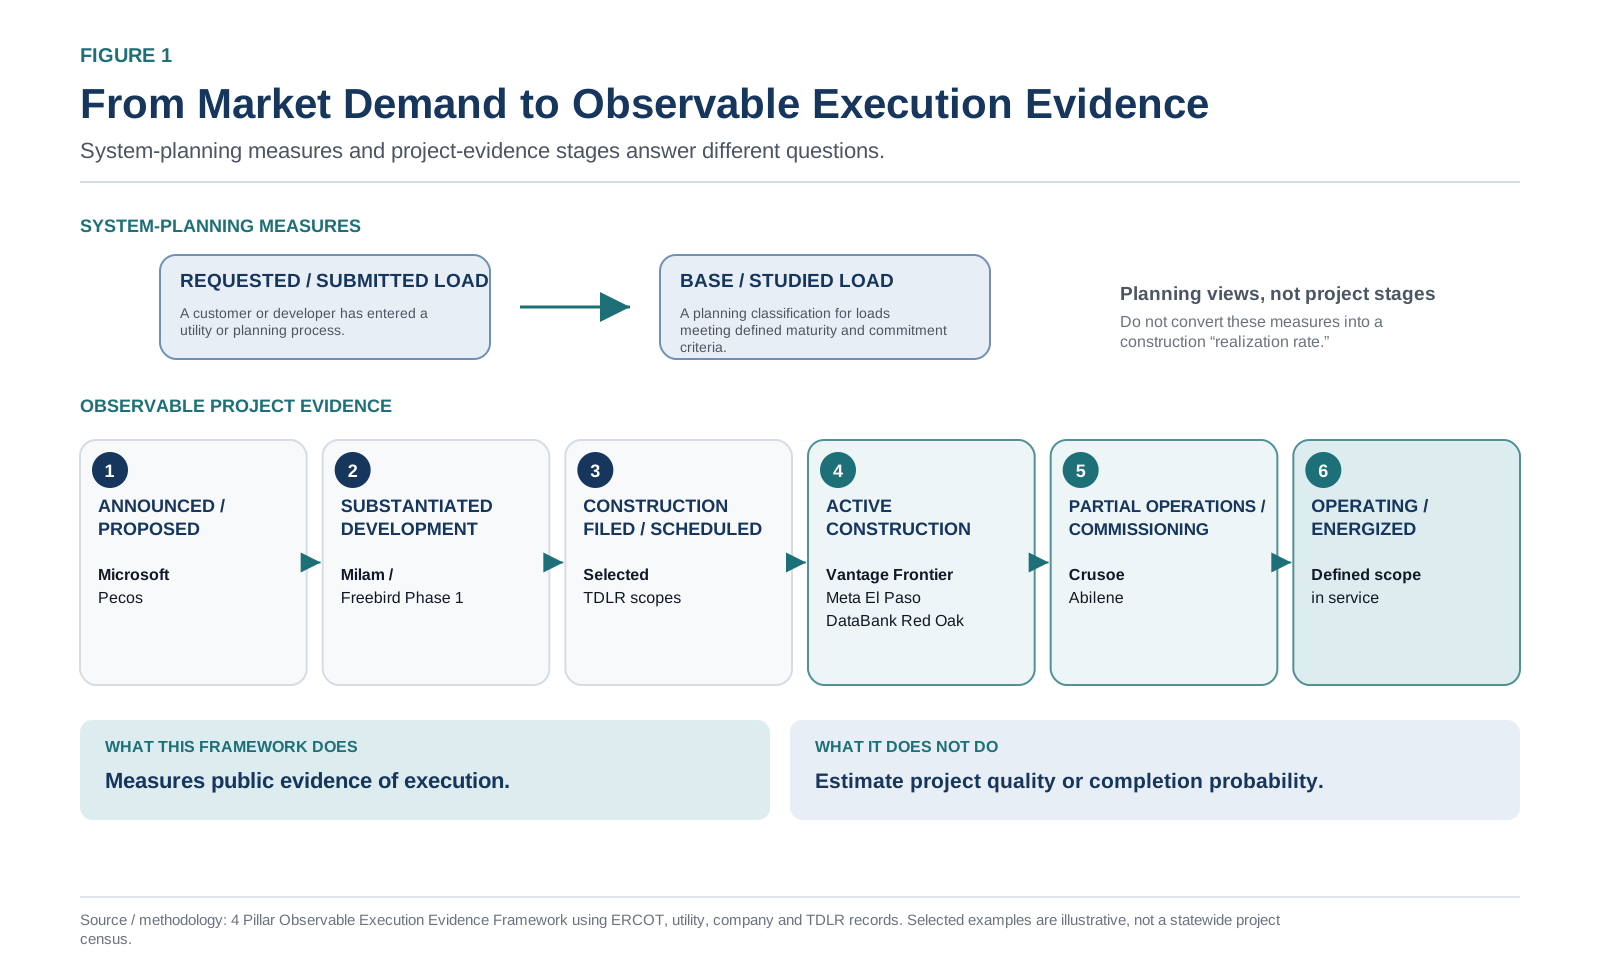
The Observable Execution Evidence Framework classifies what an outside analyst can verify. It does not predict whether a project will succeed. A project with limited public disclosure may be more mature than the record suggests; a detailed announcement can still describe capacity delivered in phases over many years. Private power arrangements, tenant commitments and financing can remain confidential. The framework is therefore a discipline for handling evidence, not a substitute for developer diligence. Its purpose is to prevent the public record from being read more confidently than the evidence allows.
Announced or proposed. Microsoft says its Pecos campus could add approximately 2 GW over five to seven years and that it will fund onsite generation and supporting infrastructure. That is consequential sponsor and power-strategy evidence, not 2 GW of current construction or near-term contractor backlog.[13]
Substantiated development. OpenAI selected SB Energy to build and operate a previously announced 1.2-GW Milam County site. A TDLR record identifies Freebird Data Center Phase 1, OpenAI as tenant, four data halls, 548,950 square feet and a $470 million estimated construction cost. The registered filing establishes a defined development and building scope; it does not prove physical construction began on the scheduled date.[15][16]
Construction filed or scheduled. TDLR records can establish owner, location, scope, estimated cost and scheduled timing. They are stronger than unsourced project lists, but the estimated cost is not total campus investment and a scheduled date is not a site inspection. Multiple campus filings should not be added until separate buildings, revisions and overlapping phases are reconciled.[16]
Active construction. Vantage says construction has begun on its planned 1.4-GW, ten-building Frontier campus. Meta says its 1-GW El Paso campus is under construction. DataBank first secured $2.0 billion for three fully leased 60-MW buildings at Red Oak, then increased total construction financing to approximately $2.65 billion for a fourth 60-MW building. Leased phases, defined scope and construction funding provide stronger evidence than an ultimate campus announcement, while still falling short of guaranteed full-campus completion.[9][10][11][12]
Partial operations with continuing construction. At Crusoe’s original Abilene campus, the first two 100-MW buildings were energized while six additional buildings remained under construction toward the original 1.2-GW scale. Site preparation then began for a separate adjacent 900-MW Microsoft campus. The entire projected 2.1 GW is not operating, but Abilene is no longer merely proposed.[14]
The report does not present a statewide MW funnel because project-level capacity disclosure is incomplete and often inconsistent. Public values may refer to gross campus power, critical IT load, interconnection capacity, associated generation, energized site capacity or ultimate site capacity. Existing mining campuses add another complication: energized site infrastructure can coexist with a much smaller contracted AI block. A quantitative funnel built from those measures would obscure more than it clarifies. The defensible output is a sourced evidence framework and a curated set of examples.
III. The Infrastructure Extends Beyond the Data Hall
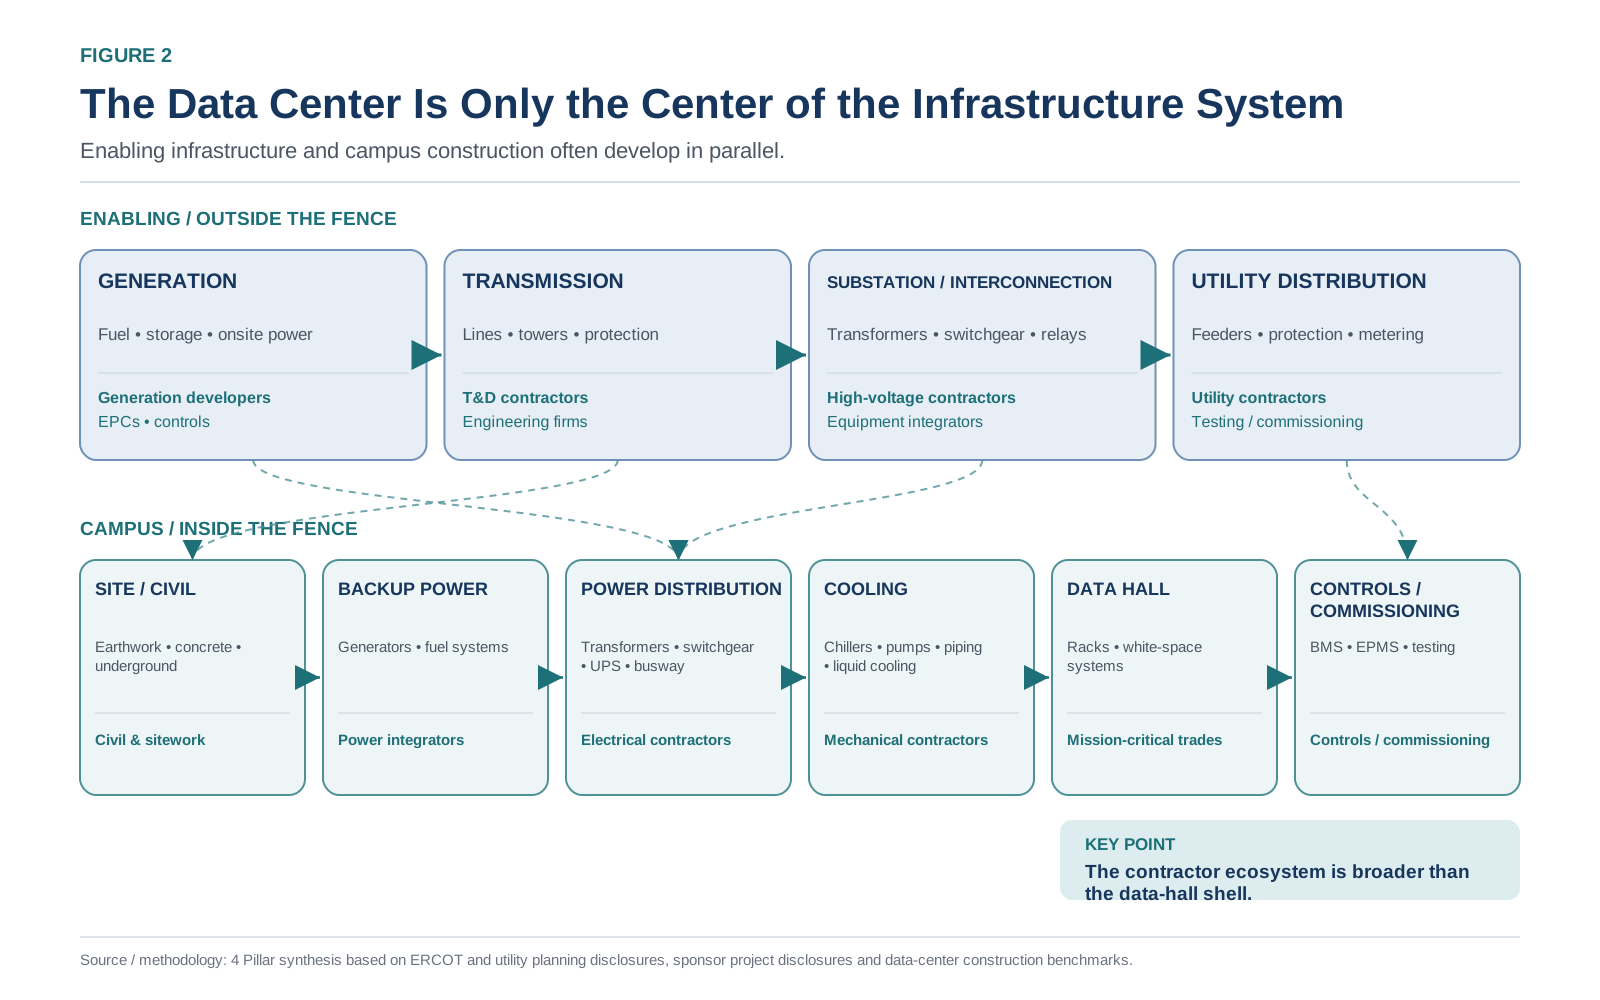
The Texas AI infrastructure opportunity is often framed as campus construction. The physical system is broader.
For many projects, generation, transmission, substations, interconnection work and protection systems develop in parallel with site work, equipment procurement and onsite construction. Behind-the-meter projects can change the sequence, but not the need for generation, switching, controls and electrical construction.
Oncor says ERCOT-endorsed projects serving portions of southern DFW, the I-35 corridor and related areas are expected to require more than $7 billion of investment between 2026 and 2034. Those projects support system reliability and broader customer growth as well as large loads.[5]
CenterPoint increased its whole-company 2026–2035 capital plan by $1.2 billion to $66.7 billion, citing accelerating Houston large-load demand and revised Downtown Houston estimates. The total is not data-center capex; it shows large-load growth influencing a broader utility portfolio.[6]
AEP Texas reports letters of agreement supporting up to 41 GW of potential new load through 2030. Its federally supported portfolio includes nearly 100 projects and approximately 2,800 miles of new or rebuilt transmission serving data centers, advanced manufacturing, generation and Permian Basin activity. Large-load development is one driver of this parallel power-infrastructure cycle.[7]
For lower-middle-market companies, the addressable ecosystem includes:
- transmission and substation contractors;
- high-voltage electrical firms;
- transformer, switchgear and controls suppliers;
- civil, underground and concrete contractors;
- backup-power and modular-infrastructure integrators;
- mechanical and cooling firms;
- commissioning and protection-system specialists;
- equipment rental, logistics and skilled-trades staffing providers.
Direct hyperscale packages often require national scale, substantial bonding, deep safety and data-center experience and the ability to manage long-lead equipment. Many lower-middle-market firms will therefore participate through utility programs, repeatable specialty packages, regional subcontracting, fabrication or distribution rather than as campus primes.
Those opportunities can be substantial even when the company never contracts directly with the hyperscaler: a substation package, modular electrical assembly or regional civil scope can still represent a step-change in backlog. The more relevant question is often which companies sit beneath the prime, support infrastructure around the project or supply the equipment and labor on which larger contractors depend.
IV. Why Electrical and Mechanical Systems Matter
Data centers differ from ordinary commercial projects in the concentration of physical cost inside power and thermal systems.
Turner & Townsend’s 2025 analysis provides an indicative U.S. comparison. Electrical systems account for approximately 54% of construction cost and mechanical systems 22% in its air-cooled benchmark; the liquid-cooled benchmark assigns 48% to electrical and 33% to mechanical. The two categories represent approximately 76% and 81%, respectively.[17]
| Indicative cost category | Air-cooled | Liquid-cooled |
|---|---|---|
| General conditions / fees | 10% | 10% |
| Core, shell and architectural | 14% | 9% |
| Mechanical, including equipment | 22% | 33% |
| Electrical, including equipment | 54% | 48% |
The benchmark is not a Texas project budget. It reflects the report’s specified U.S. facility assumptions and excludes land, utility works and active IT equipment. Designs vary in density, redundancy and cooling architecture. The narrower conclusion is that a substantial share of physical data-center construction cost can sit in electrical and mechanical systems.[17]
That makes the sector relevant to businesses combining skilled labor, early or long-lead equipment commitments and billing that may follow cost incurrence. It does not make every award cash intensive. Major equipment may be owner-furnished; advances and milestones may fund early costs; supplier terms may bridge procurement; and some assets may support conventional collateral financing.
The useful framework is qualitative. Cash intensity asks how much project cash is committed before collection. Financing friction asks how readily the resulting assets and obligations can support outside capital. A payroll-heavy staffing firm may have little hard collateral despite a short operating cycle. An equipment distributor may carry more inventory but also have supplier credit and financeable assets. An electrical contractor can face both project cash intensity and additional bonding, concentration and billing constraints.
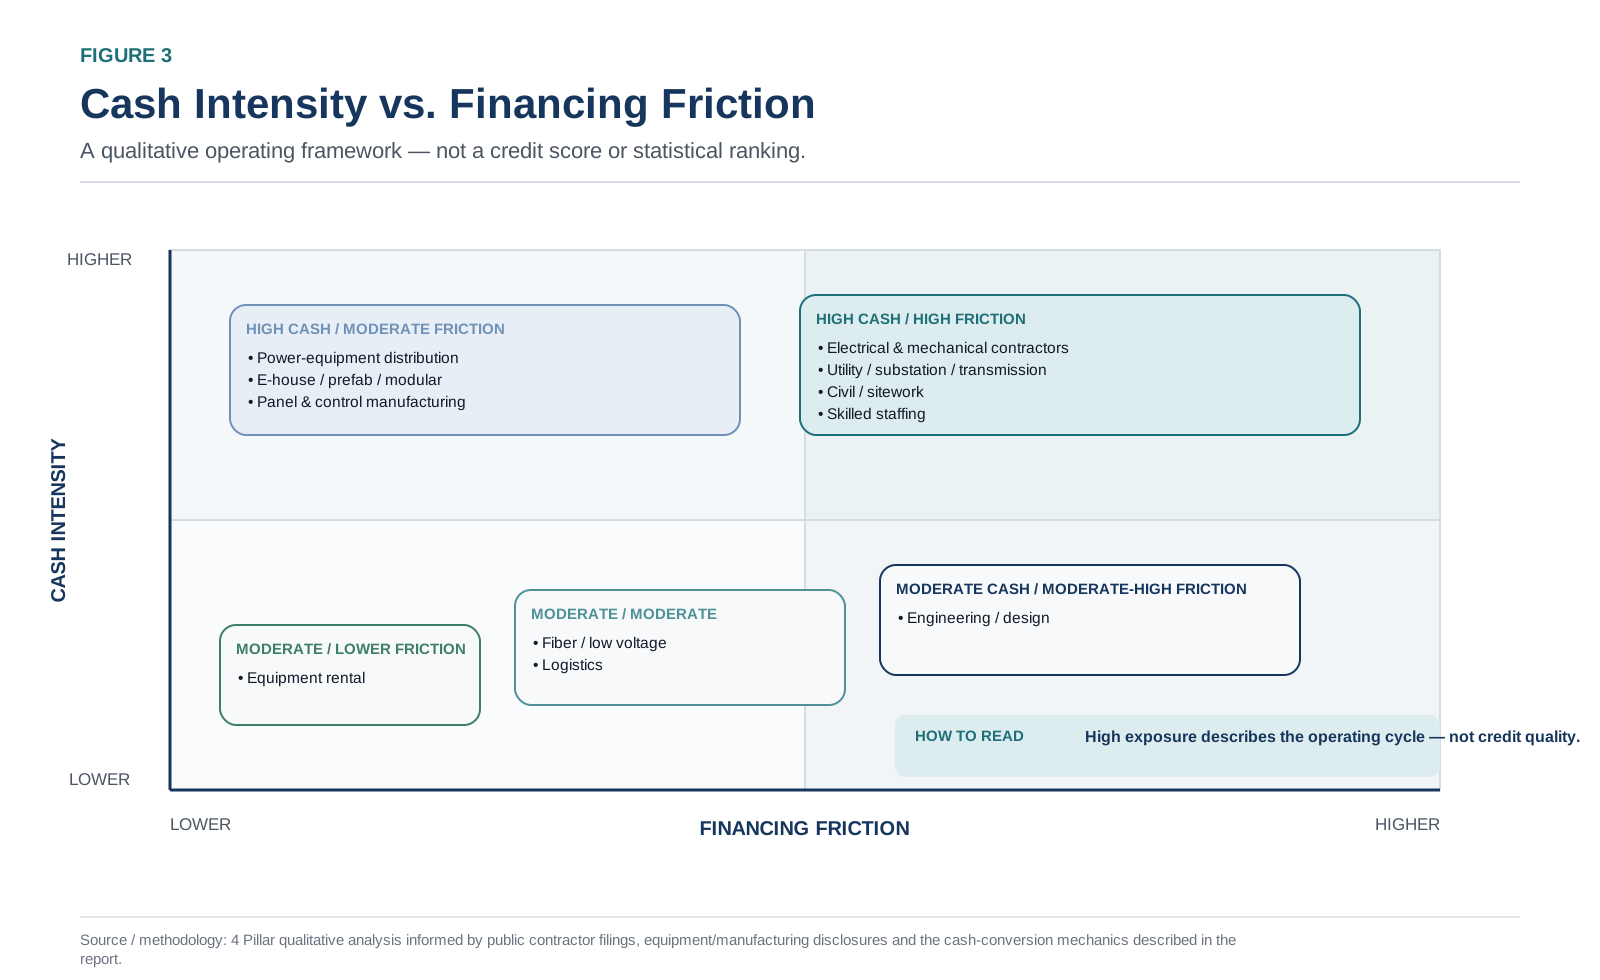
Accessible category view
High cash intensity / high financing friction
- Electrical and mechanical contractors
- Utility, substation and transmission contractors
- Civil and sitework contractors
- Skilled staffing providers
High cash intensity / moderate financing friction
- Power-equipment distribution
- E-house, prefab and modular businesses
- Panel and control manufacturing
Moderate cash intensity / moderate-high financing friction
- Engineering and design firms
Moderate cash intensity / moderate financing friction
- Fiber and low-voltage firms
- Logistics providers
Moderate cash intensity / lower financing friction
- Equipment rental businesses
How to read: High exposure describes the operating cycle—not credit quality.
V. When Backlog Becomes a Balance-Sheet Event
Public filings establish the cash-conversion mechanism without treating any public company as a representative $25 million contractor.
Comfort Systems provides the clearest description. At year-end 2025, it had 8,427 projects in process, with an average duration of six to nine months. Comfort states that projects generally require working-capital funding for equipment and labor and that periodic customer payments often do not recover those costs until late in the job. It also notes that beginning large volumes of work can increase working-capital needs because labor, equipment and subcontractor costs are paid before related receivables are billed and collected.[18]
The accounting sequence matters. A contract asset generally represents revenue recognized for performance that is not yet unconditionally billable. Once the billing right becomes unconditional, the amount can move into accounts receivable. Retainage is an earned or billed amount withheld until later milestones, completion or acceptance. A contract liability generally reflects billing in excess of recognized revenue, often because the contract permits an advance or early milestone billing. None of these balances, standing alone, reveals when cash will move or whether the underlying project is profitable.
Contract assets are not accounts receivable, contract liabilities are not necessarily collected cash, and either balance can move for reasons other than a project’s underlying profitability.
Quanta reported approximately $1.52 billion of contract assets and $3.26 billion of contract liabilities at year-end 2025. It explains that some contracts permit upfront or milestone billing and that these structures can support working-capital requirements that are generally higher early in a contract. Quanta also reported approximately $994 million of retainage expected to settle within one year, another $229 million expected beyond one year and approximately $1.10 billion of unbilled receivables.[19]
EMCOR reported approximately $945 million of billed retainage receivables at year-end 2025. MYR Group explains that larger transmission and distribution projects require financial resources for cash flow, bonds and letters of credit, and that those assurances may restrict or consume bank and surety capacity.[20][21]
These balances are not magnitude benchmarks for lower-middle-market companies, and their ratios should not be transferred into the model. They establish that the categories and financing frictions exist in the same electrical, mechanical and infrastructure sectors discussed here.
The evidence is also two-sided. Powell Industries says favorable milestones often allocate a significant portion of progress billing to early contract stages, with payment generally expected within 30 days after invoice. Quanta describes upfront and milestone billing that can support early working-capital needs. Comfort’s 2025 operating cash flow included an approximately $878 million benefit from changes in billings in excess of costs and deferred revenue, partly offset by an approximately $779 million decrease in accounts payable and other current liabilities.[18][19][22]
A contract liability can reflect a favorable billing position without representing collected cash. An early invoice may still face approval and collection risk. An advance may be recouped or bonded. Supplier terms can support the project without creating a funded loan, while retainage can defer cash after ordinary progress billing has been collected. Even so, the filings show that similar awards can have different cash profiles: one may require the contractor to fund substantial costs before collection, while another allows customers and suppliers to support more of the early cycle.
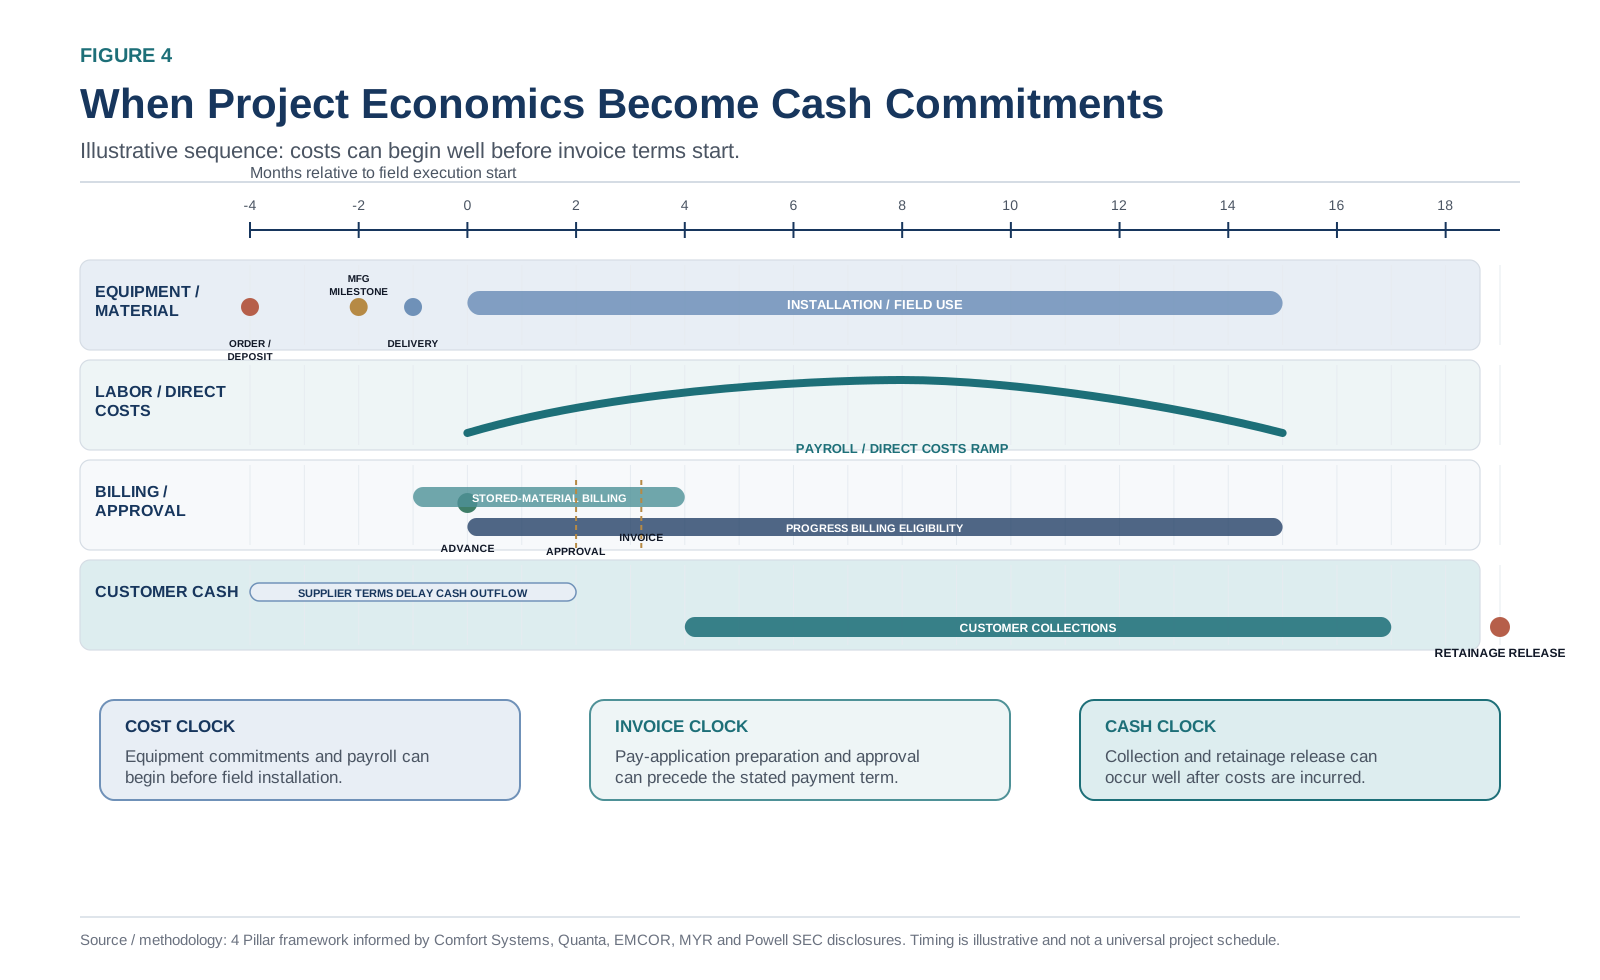
The cash path is:
scope and award → procurement and labor → billing eligibility → pay application and approval → invoice → cash collection → retainage release.
Each step can create a timing gap or a contractual offset.
VI. Same $10M Award, Six Different Project-Cash Profiles
The 4 Pillar Backlog-to-Liquidity Model asks one narrow question:
For the same hypothetical $10 million project awarded to a hypothetical $25 million contractor, how can project scope, cost timing and contract terms change the timing and size of the project-level cash deficit?
The model assumes a 15-month project, $8 million of direct project cost and $2 million of gross profit. It calculates cash by month rather than applying a working-capital percentage to contract value. The timing engine separately models project progress, labor and subcontractor cash costs, equipment order and payment events, supplier terms, stored-material billing, approval, collection, customer advances, retainage and owner-furnished equipment.
Three definitions are critical:
- Peak modeled project-cash deficit
- The largest negative cumulative month-end project-level cash position.
- Assumed usable liquidity
- Eligible cash and borrowing capacity assumed available for the incremental project after the model’s liquidity overlay.
- Residual external funding gap
- Peak modeled project-cash deficit less assumed usable liquidity, floored at zero.
The peak deficit is not automatically financing required. The company may have enough internal capacity to absorb it. The liquidity overlay therefore separates the project cash trough from the cash and borrowing capacity assumed to be genuinely usable after minimum cash, borrowing-base limits, letters of credit and other committed uses.
The six profiles
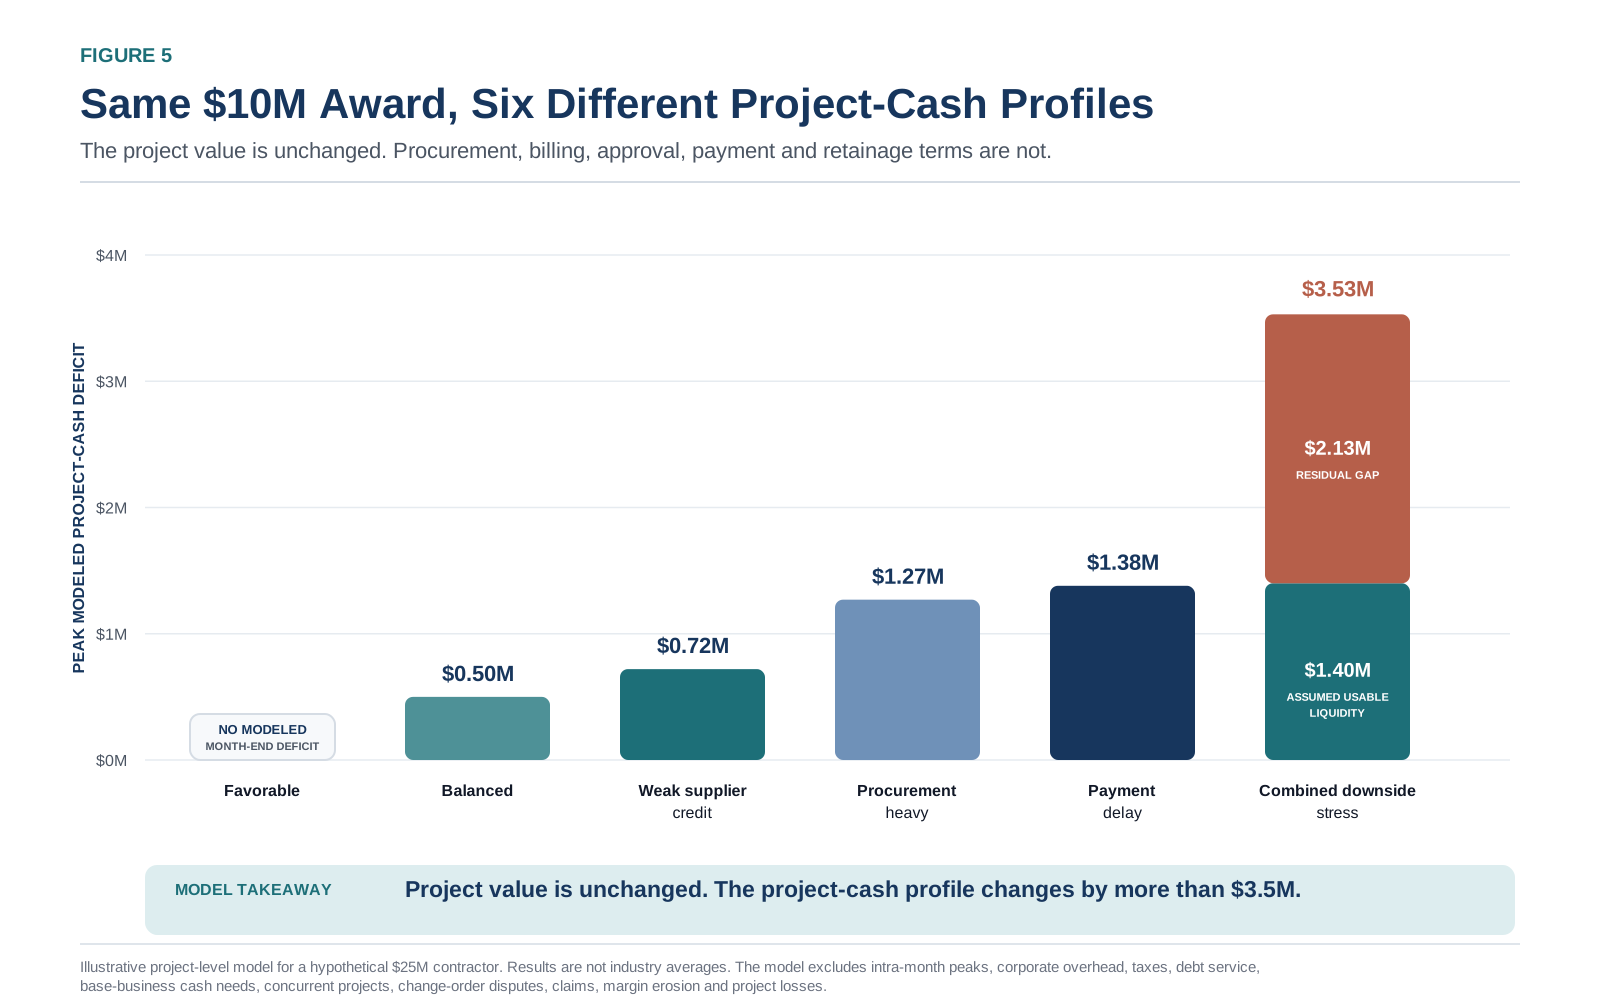
| Contract profile | Peak modeled project-cash deficit | Peak month | Assumed usable liquidity | Residual external funding gap |
|---|---|---|---|---|
| Favorable | No modeled month-end deficit | — | $1.40M | $0 |
| Balanced | ~$0.50M | 7 | $1.40M | $0 |
| Weak supplier credit | ~$0.72M | 7 | $1.40M | $0 |
| Procurement heavy | ~$1.27M | 7 | $1.40M | $0 |
| Payment delay | ~$1.38M | 8 | $1.40M | $0 |
| Combined downside stress | ~$3.53M | 9 | $1.40M | ~$2.13M |
The favorable profile combines a 10% customer advance, 60-day supplier terms, strong stored-material billing, rapid approval, 30-day customer payment and no retainage. It produces no negative month-end project-cash position. That does not establish that the contractor needs no corporate or intra-month liquidity; it shows how favorable terms can eliminate the modeled month-end deficit.
The balanced profile uses a 5% advance, 45-day supplier terms, partial stored-material billing, a 15-day approval lag, 45-day payment and 5% retainage. Procurement begins before the formal execution curve, the cumulative project position turns negative in Month 4 and peak modeled deficit reaches approximately $500,000 in Month 7. The project returns to a positive cumulative cash position in Month 11, with modeled retainage collected later. The hypothetical company’s assumed $1.40 million of usable liquidity covers the deficit, so the project creates no modeled residual external funding gap.
Under weak supplier credit, shortening supplier terms to 30 days raises the peak deficit to approximately $720,000. Under procurement-heavy terms—more long-lead material, earlier orders, larger deposits and no stored-material billing—it rises to approximately $1.27 million.
Under payment delay, balanced procurement is paired with 30-day pay-application approval and another 60 days from invoice to cash. The peak reaches approximately $1.38 million in Month 8. A contract advertised as “Net 30” or “Net 45” can therefore have a longer cost-to-cash cycle if the invoice clock begins only after pay-application preparation and approval.
The combined downside profile is a stress case, not an expected or typical result. It combines procurement-heavy scope, 30-day supplier terms, no advance, no stored-material billing, 45-day approval, 75-day payment and 10% retainage. Peak modeled deficit is approximately $3.53 million in Month 9. After $1.40 million of assumed usable liquidity, the residual external funding gap is approximately $2.13 million.
The project value and modeled gross profit are unchanged across all six profiles. The scope and timing assumptions are not. The difference is produced by when equipment is ordered and paid for, when work becomes billable, how long approval takes, when customer cash arrives and what remains in retainage. That is why the model compares project-cash profiles rather than assigning a universal liquidity percentage to backlog.
What moves the balanced model
Sensitivity analysis varies one input at a time around the balanced profile. The results show the effect on peak modeled project-cash deficit across the tested ranges in this illustrative scenario; they are not a universal contractor ranking.
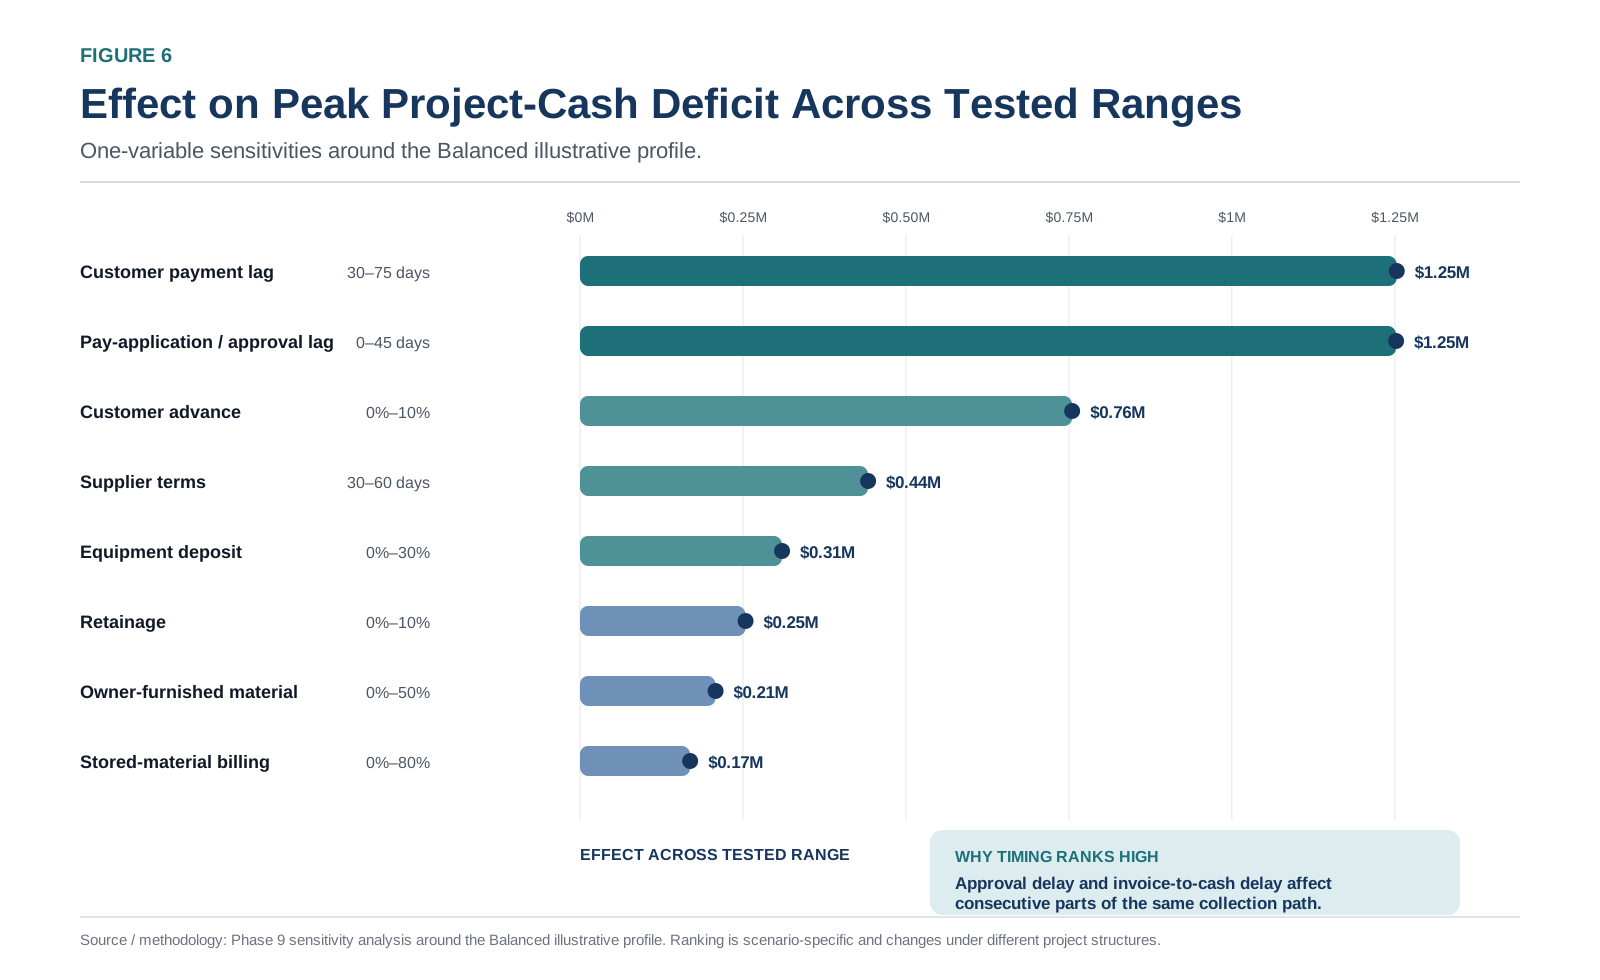
| Variable | Tested range | Effect across tested range |
|---|---|---|
| Customer payment lag | 30–75 days | ~$1.25M |
| Pay-application / approval lag | 0–45 days | ~$1.25M |
| Customer advance | 0%–10% | ~$0.76M |
| Supplier terms | 30–60 days | ~$0.44M |
| Equipment deposit | 0%–30% | ~$0.31M |
| Retainage | 0%–10% | ~$0.25M |
| Owner-furnished material | 0%–50% | ~$0.21M |
| Stored-material billing | 0%–80% | ~$0.17M |
Approval timing and payment timing are distinct. A stated payment term begins only after the contractor has earned the billing right, assembled the pay application and received approval. Each interval can leave similar project cost unrecovered for an additional period, and the effects compound when both are long. Owner-furnished equipment can also reduce contractor procurement exposure, although it may change contract value and revenue presentation; it is best treated as a project-scope variable rather than a headline statistic.
Contract value alone does not determine working-capital need. Project scope, cost timing and contract terms determine how much capital is required, when and for how long.
VII. Contract and Capital Diligence Before a Transformative Award
The financial analysis should begin before a lender term sheet. Better billing rights, procurement responsibility or approval timing can reduce the residual funding gap before debt is added.
| Contract term or scope item | Why it matters | Question for the CFO |
|---|---|---|
| Customer advance | Reduces early contractor-funded cash; may later be recouped or bonded | How much is received, when, what may it fund and how is it recouped? |
| Equipment responsibility | Determines whether major procurement sits on the contractor’s balance sheet | Which equipment is owner-furnished, contractor-procured or vendor financed? |
| Equipment milestones | Can move cash outflow months ahead of installation | When are deposits, manufacturing milestones and delivery payments due? |
| Stored-material billing | May create a billing right before installation | Which materials qualify, when does title transfer and when is cash collected? |
| Supplier terms | Can provide working-capital support | What are the actual invoice-to-payment terms and supplier credit limits? |
| Pay-application / approval | Can add time before the invoice term begins | How long from billing eligibility to approved invoice? |
| Customer payment | Determines invoice-to-cash timing | What is the realistic collection period, including historical behavior? |
| Retainage | Defers a portion of collection beyond ordinary progress billing | What percentage applies, to which billings and when is it released? |
| Change orders and claims | Can create costs before the billing right is approved | Who bears cost while scope and price are disputed? |
| Bonds and letters of credit | Can consume surety or bank capacity without an operating draw | What assurances are required, and what collateral or availability do they consume? |
Before accepting a transformative award
- Build monthly project cash flow. Model cash, not only revenue and margin.
- Separate owner-furnished from contractor-procured equipment.
- Map procurement and supplier cash dates. Include order, deposit, manufacturing, delivery and payment terms.
- Map billing eligibility. Identify what can be billed for mobilization, engineering, stored materials, milestones, installation and approved change orders.
- Model pay-application and approval lag.
- Model invoice-to-cash timing. Use actual customer behavior where available.
- Model retainage separately from ordinary collections.
- Stress unfavorable variables in combination.
- Determine assumed usable corporate liquidity after minimum cash, borrowing-base limitations, letters of credit, base-business needs and other project commitments.
- Finance only the residual timing gap.
A project deficit and an external funding gap are different measures. The balanced model reaches an approximately $500,000 project deficit but no residual gap under its liquidity overlay. Raising capital solely because the project reaches that trough would ignore the company’s existing capacity. The combined downside profile, by contrast, creates a modeled gap after the same overlay. The objective is not to eliminate every use of cash; it is to identify the portion that the existing balance sheet cannot support safely.
VIII. When Outside Capital Is Actually Needed
Once the residual gap is defined, the financing question becomes specific:
Which part of the project’s cash cycle needs to be financed, for how long, against what collateral and from what ultimate repayment source?
| Cash-conversion problem | Potential capital structure | Key eligibility limitation | What it does not solve |
|---|---|---|---|
| Slow collection of eligible billed receivables | Bank revolver; ABL; AR facility; selective factoring | Assignment restrictions; disputes; offsets; concentration; bonded receivables; progress-billing eligibility | Pre-invoice procurement or unapproved WIP |
| Long-lead supplier deposits | Working-capital line; structured facility; supplier finance; limited qualifying PO structures | Custom equipment; cancellation risk; performance obligations; limited financeable collateral | Permanent equipment ownership or poor contract economics |
| Eligible inventory or standardized WIP | ABL or inventory-backed facility | Advance rates; customization; obsolescence; ownership; borrowing-base exclusions | Non-eligible contract assets or payroll |
| Owned fleet and machinery | Equipment loan or lease | Appraised value; useful life; lien position; equipment eligibility | General operating liquidity |
| Payroll and mobilization | Revolver or growth working-capital facility | Corporate cash flow; covenants; repayment capacity | Long-term structural undercapitalization |
| Transformative award requiring multiple forms of capital | Layered revolver / ABL; equipment finance; supplier arrangements; selective term or private credit | Scale; cost; collateral overlap; intercreditor and covenant capacity | Weak margin; poor execution; speculative backlog |
| Restrictive or expensive existing debt | Refinancing or recapitalization | Payoff costs; collateral; leverage; lender appetite | An unprofitable project or unresolved operating weakness |
Source / methodology: 4 Pillar capital-structure analysis. Actual availability depends on the borrower, contract terms, collateral, legal eligibility, concentration and lender criteria. View the supplementary full-size Figure 7 SVG.
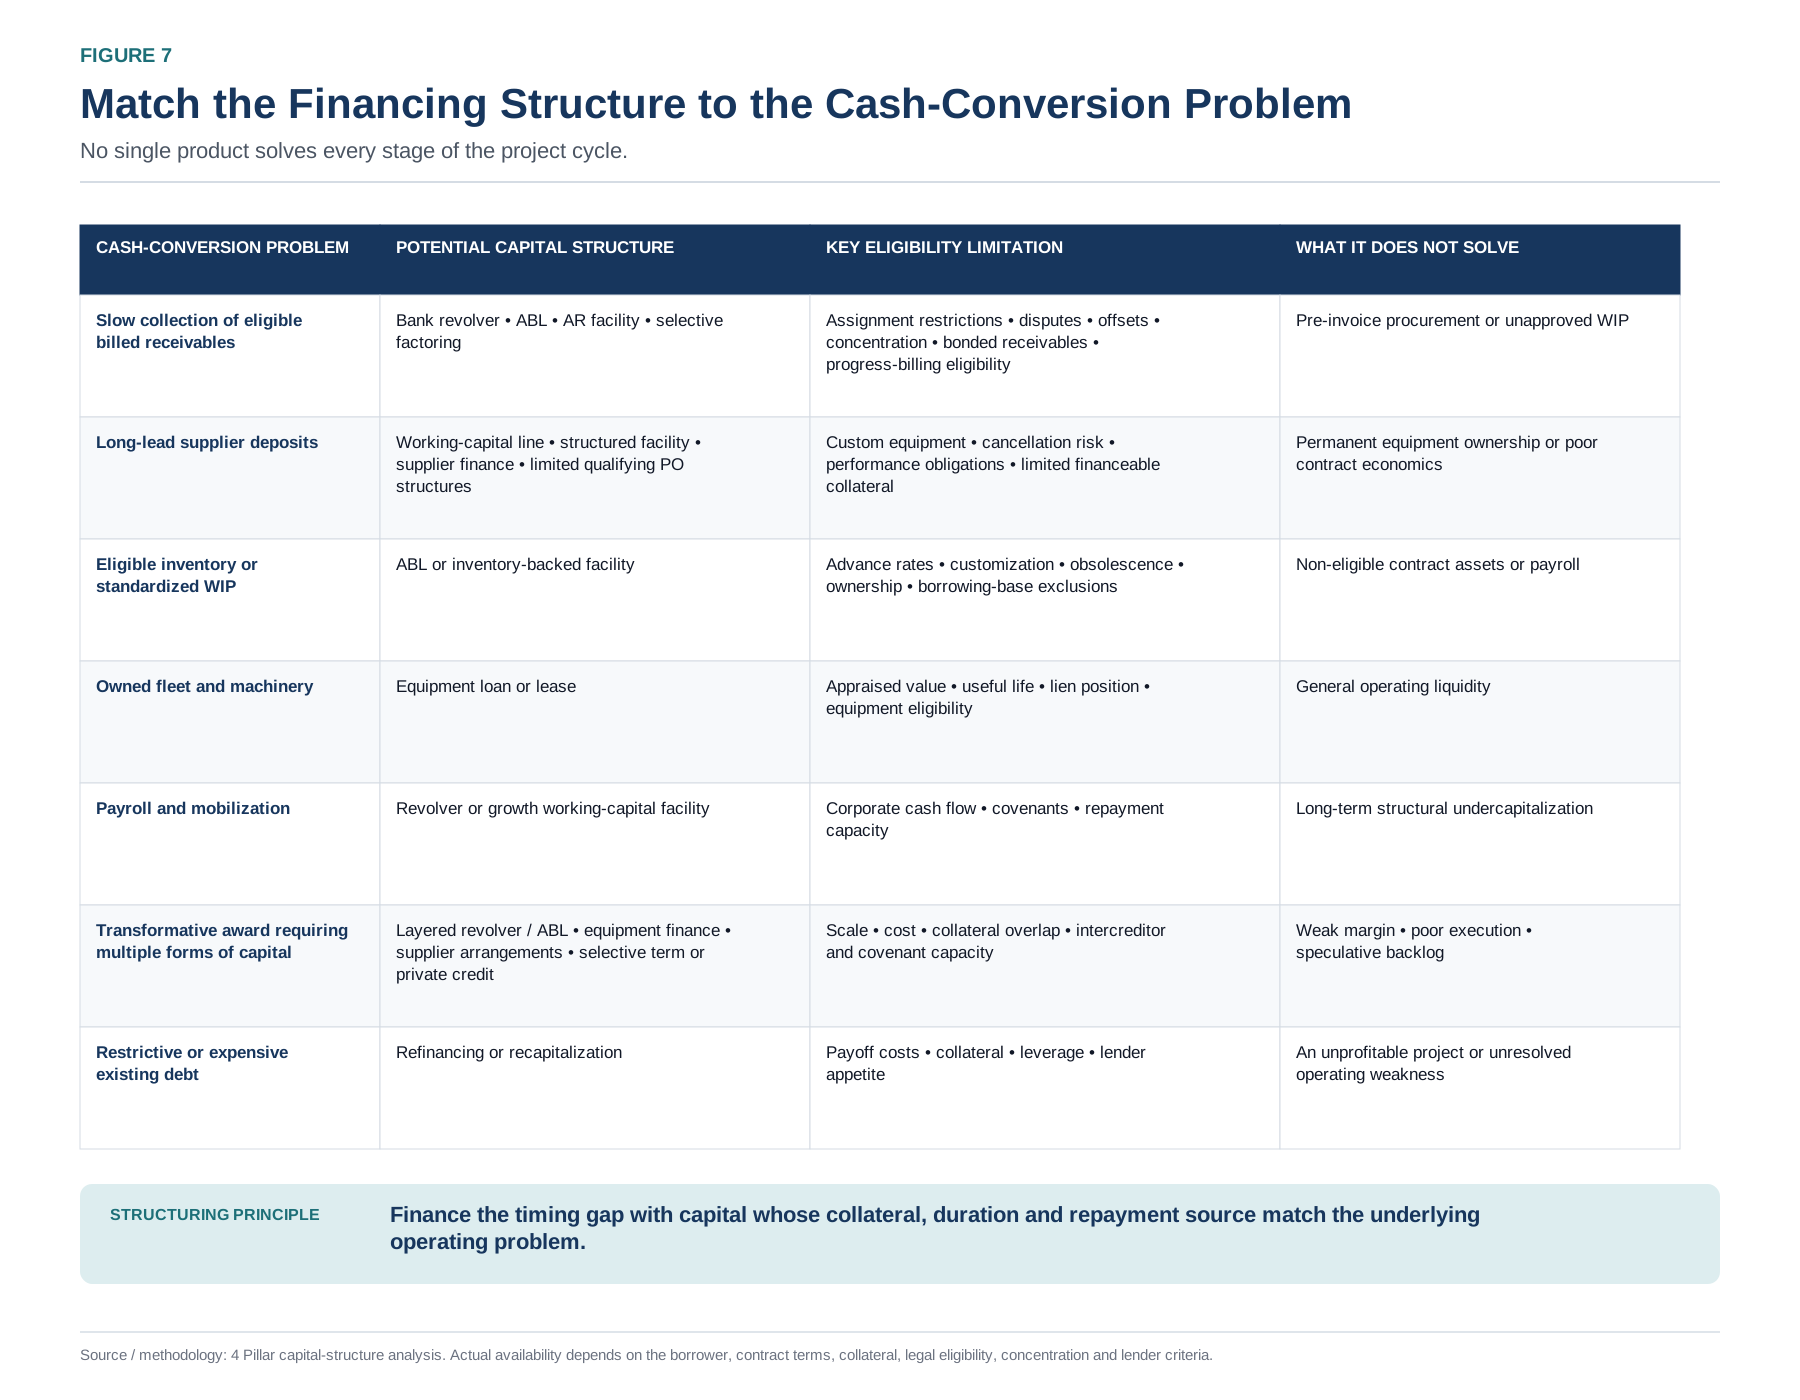
A new backlog award does not automatically expand a bank line. Backlog can support the credit case, but borrowing remains subject to collateral, covenants, concentration, lender approval, existing utilization and other obligations. In ABL, eligibility—not book value—drives availability; contract assets, retainage, progress billings, concentrated receivables, custom WIP and disputed amounts may be excluded, capped or specially conditioned. The legal right to assign receivables, customer offsets and bonding arrangements can matter as much as the receivable balance itself.
AR finance or factoring can address valid, assignable and undisputed billed receivables, but not necessarily pre-billing deposits or receivables affected by offsets, contingent payment, bonding or assignment restrictions. Retainage and contract assets may receive different or no borrowing-base treatment. Purchase-order finance applies only in limited qualifying procurement situations and is often poorly matched to labor-intensive custom construction in which the lender cannot isolate a readily saleable finished good.
Private credit can provide flexibility, duration or additional leverage for a genuinely transformative event, but it is not the automatic answer after a bank. It may carry a higher cost, stronger covenants or transaction-size requirements that are disproportionate to the need. Some awards require a layered structure: a revolver for recurring project cash, equipment finance for owned assets and supplier arrangements for specific procurement. A conventional structure may solve the problem at lower cost and complexity. Capital should bridge a viable timing gap, not compensate for weak margin or poor execution.
IX. Risks to the Texas Buildout
Texas’ infrastructure opportunity warrants disciplined skepticism. The risks differ for projects and for the companies executing them.
Risks to developers and project timing
Power and interconnection. Transmission studies, generation strategy, cost allocation and regulatory requirements can alter sequence and timing even when the sponsor remains credible. A delay can move equipment, labor and billing milestones without eliminating the eventual project. Contractors should understand who bears the cost of a delayed notice to proceed, stored equipment or deferred commissioning.
Phasing and resizing. Ultimate campus capacity is often delivered through multiple buildings and infrastructure phases. Later phases can be accelerated, deferred or redesigned. Awarded near-term scope should be separated from an owner’s ultimate campus target.
Equipment, labor and design. Power-equipment constraints can pull procurement forward or delay milestones. A contractor may have committed deposits or production slots before the owner’s schedule moves, making cancellation, storage and rescheduling terms financially important. Skilled-labor pressure can raise overtime, travel, housing and supervision costs. Changing rack density, cooling and modularization can also redistribute scope between field contractors and manufacturers.
Localized permitting and infrastructure. Water, generation emissions and community infrastructure can affect cooling design, permitting and timing, but do not support one statewide conclusion.
Risks to contractors and suppliers
Backlog quality and concentration. MYR cautions that backlog may be reduced by cancellation or scope adjustment and should not stand alone as a performance indicator. A strong counterparty may improve receivable quality while still concentrating payroll, procurement and approval risk. One delayed approval, disputed change order or design revision can affect a disproportionate share of the contractor’s cash cycle.[21]
Margin and operating capacity. The model assumes its planned $8 million direct-cost budget is achieved. Labor inefficiency, rework, escalation and unapproved change orders can turn a timing problem into an economic loss. A contractor may also lack the supervisors, safety systems, labor pipeline or procurement controls required for a step-change in scale. Liquidity cannot cure an unprofitable or operationally unmanageable contract.
Bonding and letters of credit. Project assurances can consume bank or surety capacity before cash is drawn. A stated revolver commitment may therefore overstate capacity available for working capital.[21]
Existing digital infrastructure. Riot, Cipher and Fermi illustrate why energized site power is not the same as operating AI critical IT load. Riot’s Rockdale site has 700 MW of developed capacity, but its AMD deployment is a smaller defined critical-IT block; Corsicana similarly separates developed mining infrastructure from a new data-center build.
Cipher’s Black Pearl and Barber Lake combine energized electrical infrastructure with AI/HPC construction, contracted critical IT and phased future delivery. Fermi describes an ultimate 17-GW private-power concept while separately reporting early civil and power work, permits, equipment activity and financing. These are not interchangeable measurements. Each project must be tracked by the scope actually contracted, constructed and operating.[25][26][27]
Finance defined, executable scope—not an undifferentiated headline pipeline.
X. Conclusion
Texas’ AI infrastructure market is large enough that neither enthusiasm nor skepticism should substitute for classification.
At the market level, a requested megawatt, a planning-classified load, a construction-stage project and energized capacity are different things.
At the contractor level, contract value, backlog, peak project-cash deficit and available corporate liquidity are different things.
The same discipline applies to both: measure the evidence behind the demand, then measure how the contract converts costs into cash.
That is how an operator can pursue a major infrastructure cycle without confusing revenue opportunity with balance-sheet capacity.
Model the cash terms of the backlog before you finance the backlog.
About 4 Pillar Funding
4 Pillar Funding works with established operating companies evaluating capital requirements around major growth events. It helps management teams model the timing and size of the cash requirement, assess existing liquidity and determine whether an appropriately matched capital structure is warranted.
Methodology and Model Assumptions
Public-source research
This report uses public primary sources wherever available, including ERCOT, Texas utilities, the Texas Comptroller, TDLR, company disclosures and SEC filings. High-quality industry benchmarking is used where no comparable public regulatory dataset exists.
The broader Texas project database was assembled from qualifying-data-center registrations[8] and supplemented with project-specific company, utility, permitting, financing and construction records. It is not a comprehensive census of all Texas data centers and should not be used to estimate statewide installed or planned capacity.
Observable Execution Evidence Framework
The framework classifies public evidence rather than project quality or probability.
| Category | Required public evidence | Permitted inference | Prohibited inference |
|---|---|---|---|
| Announced / proposed | Direct sponsor, developer or government announcement | A project concept has been publicly identified | Financing, physical start or ultimate completion |
| Substantiated development | Formal evidence beyond publicity, such as tax registration, site/development record or direct power/developer evidence | Development has advanced beyond a general concept | Construction or committed full-campus spend |
| Construction filed / scheduled | Project-specific TDLR or comparable permit/construction record | Defined building scope and scheduled timing exist | Physical work began as scheduled |
| Active construction | Direct primary-source confirmation of physical work underway | The defined scope is in physical execution | All planned phases will complete on schedule |
| Partial operations / commissioning | Direct evidence that a material phase is live or commissioning while broader build continues | Some capacity is operating | Ultimate campus capacity is operating |
| Operating / energized | Direct evidence that the defined scope is operational | The stated scope is in service | Future expansion is complete |
The stages are not necessarily linear in public records. Utility and financial arrangements may remain confidential, and some equipment procurement may precede public construction filings.
Why no statewide MW funnel is presented
The research universe does not contain sufficiently complete, consistently defined project-level MW to calculate a defensible statewide stage funnel. Public values may refer to utility service requests, interconnection capacity, gross campus power, critical IT load, associated generation, energized site capacity or operating AI capacity. These measures should not be added without reconciliation. The report therefore uses selected project examples and a qualitative evidence framework rather than manufacturing an apparently precise statewide result.
Construction-cost benchmark
The Turner & Townsend allocation is presented as an indicative U.S. benchmark under its stated assumptions and exclusions. It is not used as a project-level budget or contractor working-capital ratio.
Public-company evidence
SEC filings are used to establish that specific cash, accounting and financing mechanisms exist. Public-company balances and ratios are not treated as expected values for a $25 million contractor.
Core model purpose
The model tests how the same hypothetical project can produce different project-level cash profiles under different scope, timing and contract assumptions. It is not an industry average, a lender underwriting model or a corporate forecast.
Central project
| Input | Balanced assumption |
|---|---|
| Historical contractor revenue | $25.0M |
| Project value | $10.0M |
| Modeled direct project cost | $8.0M |
| Modeled gross profit | $2.0M |
| Project duration | 15 months |
| Labor share | 25% of project value |
| Material/equipment share | 45% |
| Subcontractor share | 7% |
| Other direct cost | 3% |
Balanced procurement and billing assumptions
| Input | Balanced assumption |
|---|---|
| Long-lead share of contractor-procured material | 50% |
| Procurement order lead | 4 months before installation |
| Manufacturing milestone lead | 2 months before installation |
| Delivery lead | 1 month before installation |
| Equipment deposit | 10% of long-lead cost |
| Manufacturing milestone invoice | 30% of long-lead cost |
| Supplier terms | 45 days |
| Stored-material billing eligibility | 40% of long-lead cost |
| Stored-material billing lead | 1 month before installation |
| Pay-application / approval lag | 15 days |
| Customer payment lag | 45 days after approved invoice |
| Customer advance | 5% of contractor cash contract |
| Retainage | 5% |
| Retainage release | 3 months after modeled completion/approval period |
Balanced liquidity overlay
| Input | Assumption |
|---|---|
| Cash balance | $700K |
| Minimum operating cash | $300K |
| Revolver commitment | $2.0M |
| Current revolver draw | $1.0M |
| Incremental borrowing-base availability | $1.0M |
| Letters of credit / lender reserves | $0 |
| Base-business liquidity reserve | $0 |
| Other-project commitments | $0 |
| Assumed usable liquidity | $1.40M |
A real company should replace the zero base-business and other-project reserves with its actual requirements.
Timing engine
The active monthly progress curve is generated using normalized sine-based weights:
weight(m) = sin(pi * m / (duration + 1)) ^ exponent
The balanced model uses a 1.5 exponent. The weights are normalized to 100%, so changing duration reshapes the execution schedule.
Day-based supplier, approval and customer-payment lags are converted into fractional months using 30.4375 days per month. Cash is distributed between the two adjacent months according to the fractional result rather than through a fixed hard-coded split.
Long-lead procurement is modeled through order/deposit, manufacturing milestone, delivery and installation. Deposits are credited against later supplier obligations. Stored-material billings are subtracted from later progress billings to prevent double counting. Customer advances are received at Month 0 and recouped from subsequent progress billings.
Output definitions
- Peak modeled project-cash deficit
- Largest negative cumulative month-end project-level cash position.
- Assumed usable liquidity
- Modeled eligible cash and borrowing capacity available to support the incremental project after the liquidity overlay.
- Residual external funding gap
- Peak modeled project-cash deficit less assumed usable liquidity, floored at zero.
Model limitations
The model excludes intra-month peaks, SG&A, taxes, debt service, corporate capex, acquisition commitments, base-business cash needs except through the simple overlay, simultaneous project cash requirements, change-order disputes, claims, margin erosion, project losses, financing fees and interest.
Appendix C - Selected Core Texas Project Table
This table is illustrative and not a statewide census.
| Project | Location | Publicly disclosed scale | Observable evidence | What the evidence does not establish | Sources |
|---|---|---|---|---|---|
| Microsoft Pecos | Pecos / Reeves County | Approx. 2 GW capacity addition over 5–7 years | Direct sponsor announcement; behind-the-meter power plan | Current constructed or near-term energized capacity | [13] |
| OpenAI / SB Energy Milam—Freebird Phase 1 | Milam County | 1.2-GW site; TDLR Phase 1 building 548,950 sf | Sponsor/developer relationship plus registered $470M TDLR scope | Public proof of physical start or final campus cost | [15] [16] |
| Vantage Frontier | Shackelford County | 1.4 GW, 10 buildings | Company says construction has begun | Ultimate phase delivery and final spend | [9] |
| Meta El Paso | El Paso | 1 GW compute; >$10B Meta investment; ~$14B total development cost | Company says campus is under construction | Full delivery schedule beyond initial 2028 capacity | [10] |
| DataBank Red Oak | Ellis County | 480 MW planned; first four buildings 240 MW | Leased first three buildings; $2.0B initial financing; $2.65B after fourth-building upsize | Full eight-building completion | [11] [12] |
| Crusoe Abilene original campus | Taylor County | 1.2 GW planned | First two 100-MW buildings energized; six additional buildings under construction | Full 1.2-GW operation before completion | [14] |
| Crusoe / Microsoft Abilene expansion | Taylor County | 900 MW; two buildings | Land clearing and site preparation underway | Mid-2027 energization or full 900-MW delivery | [14] |
| Crusoe / Lancium Childress | Childress County | 1 GW announced | Direct developer announcement and interconnection claim; construction targeted Q3 2026 | Physical construction start as of report date | [32] |
| Microsoft SAT82 | Medina County | MW not public | Multiple TDLR building/scope filings | Whether filings are additive, revised or physically underway | [29] |
| Amazon Project Eagle | Wharton County | MW not public | Multiple owner-identified TDLR scopes with scheduled starts | Physical start, total campus cost or MW | [30] |
| Riot Rockdale / Corsicana | Milam and Navarro Counties | 700 MW and 400 MW developed site capacity; smaller defined AI/HPC scopes | Existing mining infrastructure; 50 MW contracted AMD critical IT at Rockdale; Corsicana core/shell development initiated | Conversion of all site capacity into AI operating load | [25] |
| Cipher Black Pearl / Barber Lake | Texas | 300 MW gross at each project; 216 MW and 207 MW contracted critical IT, respectively | Energized electrical sites plus active AI/HPC construction and future delivery schedules | Current operation of the full contracted AI load | [26] |
| Fermi Project Matador | Texas Panhandle | Company-stated 17-GW ultimate private-power concept; ~6 GW permitted | Early civil/power work, permits, equipment and financing activity | Near-term 17-GW compute capacity or full tenant commitment | [27] |
Final publication-day freshness checks
- ERCOT’s 2026 all-time peak after additional settlement passes.
- Whether ERCOT has published an official statewide Batch Zero aggregate or revised classification statistics.
- Oncor’s latest request, Batch Zero expectation and collateral definitions.
- CenterPoint’s submitted and expected-eligible Batch Zero figures.
- AEP Texas’ current potential-load and transmission-program figures.
- Whether Vantage Frontier’s first building has reached its stated H2 2026 delivery milestone.
- Meta El Paso construction status and venture close.
- DataBank Red Oak building delivery and financing scope.
- Physical status of Milam County Freebird Phase 1 and Childress.
- Abilene building energization and construction status.
- Cipher Black Pearl and Barber Lake delivery status.
- Riot’s delivered and contracted AMD critical IT load and Corsicana core-and-shell progress.
- Fermi’s permit, tenant, financing and first-power status.
- Any project-specific statement that uses “under construction,” “energized” or “operating.”
Sources
All web sources were retrieved or revalidated for this report on August 11, 2026.
- ERCOT, “2026 Peak Demand Records,” last updated July 27, 2026. View source. ↩
- ERCOT, “ERCOT Releases Preliminary Long-Term Load Forecast for Years 2026–2032 for PUCT Discussion,” April 15, 2026. View source. ↩
- ERCOT, “PUCT Approves ERCOT’s Batch Zero Process for Large Loads,” June 18, 2026. View source. ↩
- ERCOT, Market Notice M-B062326-04, Batch Zero implementation dates and public-statistics notice, July 2026. View source. ↩
- Oncor, “Oncor Reports Second Quarter 2026 Results,” August 6, 2026. View source. ↩
- CenterPoint Energy, “CenterPoint Energy Reports Strong Q2 2026 Results; Provides Update on ERCOT’s Batch Zero Process,” July 28, 2026. View source. ↩
- AEP, “AEP Texas Advances Reliability and Growth with Federal Funding Expected to Save Customers $685 Million,” July 8, 2026. View source. ↩
- Texas Comptroller, “Data Centers” and registered qualifying data-center records. View source. ↩
- Vantage Data Centers, “Vantage Data Centers Unveils Plans for Frontier,” August 19, 2025. View source. ↩
- Meta, “Meta Announces New Strategic Venture With BlackRock to Develop Data Center in El Paso,” July 2026. View source. ↩
- DataBank, “$2.0B Construction Financing for First Three Data Centers on New South Dallas Campus,” April 21, 2026. View source. ↩
- DataBank, “$1.45 Billion in New Financing Across Two Transactions,” June 15, 2026. View source. ↩
- Microsoft, “Powering the Next Wave of AI: Expanding Capacity With Our New Datacenter in Pecos,” June 22, 2026. View source. ↩
- Crusoe, “New 900 MW AI Factory Campus in Abilene,” March 27, 2026. View source. ↩
- OpenAI, “OpenAI and SoftBank Group Partner With SB Energy,” January 9, 2026. View source. ↩
- Texas Department of Licensing and Regulation, Freebird Data Center Phase 1, TABS2026017746, registered April 15, 2026. View source. ↩
- Turner & Townsend, “Data Centre Construction Cost Index 2025—Data Centre Cost Trends.” View source. ↩
- Comfort Systems USA, Form 10-K for year ended December 31, 2025. View source. ↩
- Quanta Services, Form 10-K for year ended December 31, 2025. View source. ↩
- EMCOR Group, Form 10-K for year ended December 31, 2025. View source. ↩
- MYR Group, Form 10-K for year ended December 31, 2025. View source. ↩
- Powell Industries, Form 10-K for year ended September 30, 2025, and Form 10-Q for quarter ended December 31, 2025. View Form 10-K and Form 10-Q. ↩
- Riot Platforms, Form 10-Q for quarter ended March 31, 2026. View source. ↩
- Cipher Mining, Form 10-K for year ended December 31, 2025, and Form 10-Q for quarter ended March 31, 2026. View Form 10-K and Form 10-Q. ↩
- Fermi America, Project Matador disclosures and fiscal-year 2025 shareholder materials. View company site and shareholder materials. ↩
- TDLR, Microsoft SAT82 filing, TABS2026008231. View source. ↩
- TDLR, Amazon Project Eagle building filing, TABS2026023832. View source. ↩
- Crusoe and Lancium, “1.0 Gigawatt AI Data Center Campus in Childress, Texas,” July 15, 2026. View source. ↩
Additional primary sources reviewed
These sources informed the broader research process but are not cited to a specific statement in the final report.
- Sterling Infrastructure, Form 10-K for year ended December 31, 2025. View source.
- IES Holdings, Form 10-K for year ended September 30, 2025. View source.
- U.S. Department of Energy, distribution-transformer supply-chain materials. View source.
- TDLR, BT Gateway filing, TABS2026023619. View source.
Frequently Asked Questions
- Does ERCOT’s 367.8-GW forecast mean that amount of data-center capacity will be built?
- No. It is a preliminary planning forecast covering prospective electricity demand, not a committed data-center project list or construction forecast.
- Why does the report not calculate a statewide data-center MW funnel?
- Public disclosures mix requested load, interconnection capacity, gross campus power, critical IT load, associated generation and energized capacity. Adding those measures without reconciliation would create false precision.
- Does a $10 million award automatically create a financing need?
- No. In the illustrative model, the same award ranges from no modeled month-end deficit to a $3.53 million peak deficit. Existing usable liquidity covers some profiles completely.
- What contract terms most affect project cash timing?
- In the balanced illustrative sensitivity, customer payment lag and pay-application approval lag have the largest effects across their tested ranges. Advances, supplier terms, deposits, retainage and billing rights also matter.
- What is the difference between a project-cash deficit and an external funding gap?
- The project-cash deficit is the project’s deepest cumulative month-end cash trough. The external funding gap is the portion left after assumed usable corporate liquidity is applied.
- Which financing structure fits a data-center infrastructure award?
- There is no universal structure. The financing should match the specific timing gap, collateral, duration and repayment source; it cannot repair weak margin or poor execution.